Understanding Key Media Metrics.

Hello! This post is the last of a six-part series I’m creating as part of the Global Media Planning module for my Masters in Marketing and Digital Communications. Each instalment will tackle a different question from the assignment brief, and I’ll be sharing my progress along the way. The final assignment submission will bring everything together by focusing on three of the most important questions. Whether you’re interested in global media planning or just curious about the behind-the-scenes of a master’s assignment, I hope you find these insights useful. Thanks for following along!
Identify three media campaign performance metrics and discuss the value and limitations of them.
Measurement has always been my weak spot – I find myself getting defensive before the reports have even run. For years, I've found myself drowning in data, celebrating sky-high click-through rates one minute, then wondering why nobody's buying anything the next. Sound familiar? After years of wrestling with campaign data and watching creative ideas either succeed or fail spectacularly, I've learned that the secret isn't finding the perfect metric. It's understanding what your numbers are really telling you – and more importantly, what they're not telling you (Marketing Insider Group 2024).
In an article on Siteimprove, Saphia Lanier shares a useful table of ‘pretender metrics to avoid’ (figure 1).
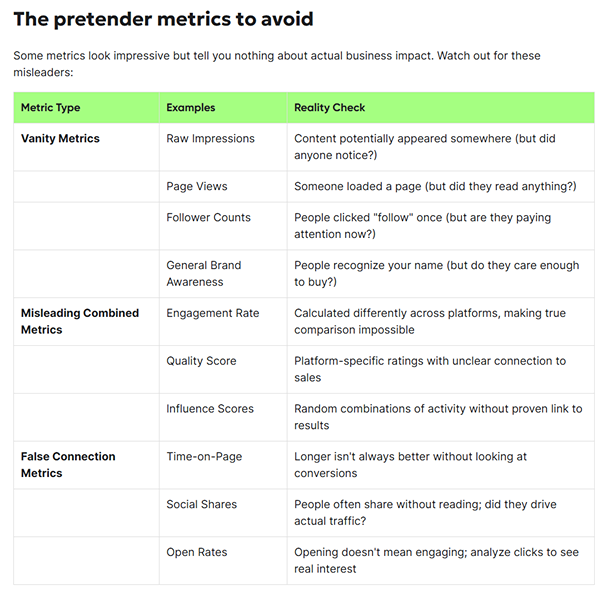
Now, having researched the topic for this post, part of a series on Global Media Planning for a master’s assignment – here are the metrics I would turn to: Click-Through Rate (CTR), Conversion Rate, and Cost Per View (CPV). Each one has its strengths, but they all have significant limitations too (Lanier 2025).
Click-Through Rate
CTR is like that colleague who always looks impressive on paper but might not deliver when it counts. It measures how many people click on your ad after seeing it, and on the surface, it seems straightforward. High CTR? People like your ad. Low CTR? Time to rethink your approach. But is that right? CTR measures curiosity, not commitment. It tells you if your ad is interesting enough to make someone click, but it doesn't tell you if they'll stick around or do anything meaningful once they arrive.
But there's a problem we need to keep in mind – CTR can be manipulated. Add some clickbait to your ad ("You Won't Believe What Happens Next!"), and watch those click rates soar. But you'll also watch your brand reputation suffer when people realise they've been misled. Additionally, CTR is susceptible to click fraud and does not provide context about what happens after a click, making it a limited measure of true campaign effectiveness.
Conversion rate – where value lives
Now we're talking about what matters. Conversion rate tells you how many people took the action you wanted them to take – whether that's buying your product, signing up for your newsletter, or downloading your app (Marketing Insider Group 2024). But conversion rate has its challenges too. Attribution is genuinely difficult. Someone might see your YouTube ad on Tuesday, think about it over coffee on Wednesday, Google your brand on Thursday, and finally make a purchase on Friday after clicking through from an email. Which campaign gets the credit? Most platforms use short attribution windows, so your carefully crafted video campaign might not get the recognition it deserves (Siteimprove 2025).
The solution? Don't rely on any single platform's data. Cross-reference everything, extend your attribution windows where possible, and remember that sometimes the best campaigns are the ones that plant seeds rather than demand immediate results (Kotler & Keller 2023).
Cost per view – efficient, but is it effective?
CPV is the budget-conscious marketer's favourite metric. It tells you exactly how much you're paying for each view of your video ad (usually defined as someone watching for at least 30 seconds or interacting with it) (Retainr nd). It's excellent for keeping costs down and making sure you're not paying for people who aren't even paying attention. But the thing about CPV is that it's a bit like judging a restaurant by its prices rather than its food quality. A low CPV might mean you're reaching loads of people cheaply, but are they the right people? Campaigns with fantastic CPVs might reach millions of viewers in markets where the brand wasn't even available for purchase. Great for the numbers, terrible for the business. Plus, CPV treats someone who watches 31 seconds the same as someone who watches your entire 3-minute ad (Retainr nd).
The secret… context is everything
What I’ve concluded is that none of these metrics mean anything in isolation. They're like ingredients in a recipe – individually they might be useful, but together they create something much more valuable (Siteimprove 2025). If you're running a brand awareness campaign, CTR and CPV are your priorities. You want to get your message out there efficiently and spark interest. But if you're trying to drive sales, conversion rate should be your focus, even if it means sacrificing some of those feel-good vanity metrics. An old retail boss once told me turnover is vanity, margin is sanity – I think the same logic can be applied to CTR and conversion – CTR is vanity and conversion rate is sanity.
The best campaigns I've worked on have been the ones where we've looked at all the data together, understood what each metric was telling us, and then made decisions based on what we were actually trying to achieve.
The Bottom Line
Measuring campaign performance isn't about finding the perfect metric – it's about understanding what story your data is telling you. CTR shows you if people are interested. Conversion rate shows you if they're committed. CPV shows you if you're being efficient with your budget. Together, they give you a clearer picture of what's working and what isn't (Siteimprove 2025).
Once you start thinking about metrics this way, those campaign reviews become significantly less stressful – and much more useful. And honestly? It makes me feel a whole lot better about measurement being my weak spot. Now I realise the numbers are just half the story. The real value comes from turning that data into actionable insights that actually improve your campaigns (Marketing Insider Group 2024).
Thanks so much for reading. I’d really love to hear what you think, whether you agree, disagree, or just want to chat about media planning (or assignment writing!). Feel free to comment on my LinkedIn posts (where I’ll be sharing each part) or drop me an email. Your feedback will be a huge help as I decide which three posts to polish up for my final assignment. Looking forward to connecting!

References
Lanier (2025) How to Measure the Effectiveness of Marketing Campaigns. Available at: https://www.siteimprove.com/blog/measuring-marketing-campaign-effectiveness/ (Accessed: 3 July 2025).
Marketing Insider Group (2024) Analyzing the Performance of Your Paid Media Campaigns: Key Metrics. Available at: https://marketinginsidergroup.com/marketing-strategy/analyzing-the-performance-of-your-paid-media-campaigns-key-metrics/ (Accessed: 3 July 2025).
Retainr (no date) 7 Metrics To Analyze Your YouTube Ad Performance. Available at: https://www.retainr.io/blog/7-metrics-to-analyze-your-youtube-ad-performance (Accessed: 3 July 2025).
Lanier (2025) How to Measure the Effectiveness of Marketing Campaigns. Available at: https://www.siteimprove.com/blog/measuring-marketing-campaign-effectiveness/ (Accessed: 3 July 2025).
Kotler, P. and Keller, K.L. (2023) A Framework for Marketing Management. 8th edn. Harlow: Pearson.
Comments